Dash is Deeper than Dashboards
The missing link that makes Python a fullstack language

Prologue: to set the stage, reference Brief History of Reactive Web Dev, which has been abstracted out of this post.
💡 Why is Dash so revolutionary?
Dash’s reactive front end is the missing link that makes Python a truly compelling full-stack language. It enables each layer of the application stack (e.g. front end and backend) to interact with the same data using the same session of the same programming language which makes for a more rapid, simple, and intuitive development process.
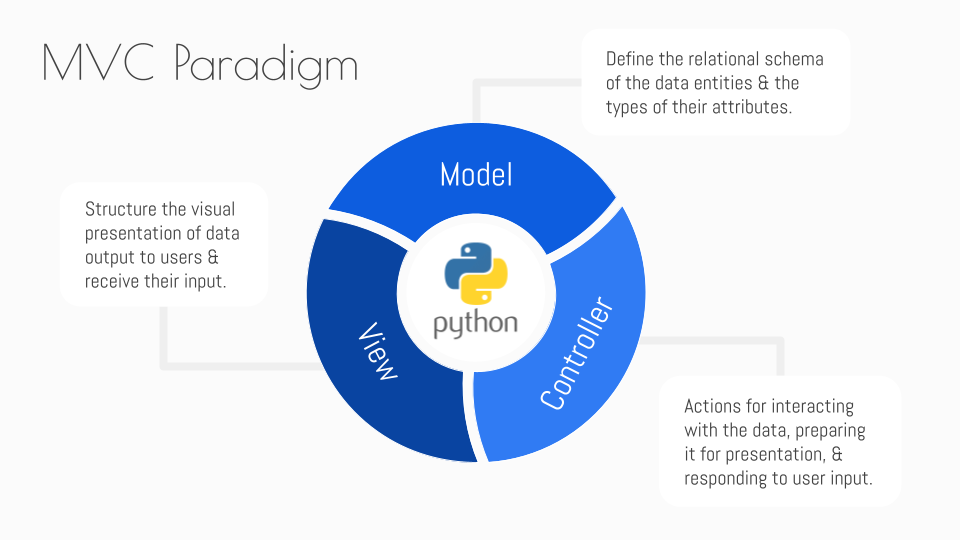
Dash revolutionizes the Model-View-Controller (MVC) paradigm of application development level by:
- Tightly integrating a real-time Controller with the View.
- Removing the need for redundant data serialization & overly formal APIs between different application layers/ programming languages. Once data is read into memory as a Python object, complex objects like Pandas DataFrames can be passed around the stack fluidly.
- Enabling full-stack apps to be published as simple Python packages.
Simply put, Dash empowers any Python developer to become a full-stack, 10x powerhouse.
🔩 How does Dash work?
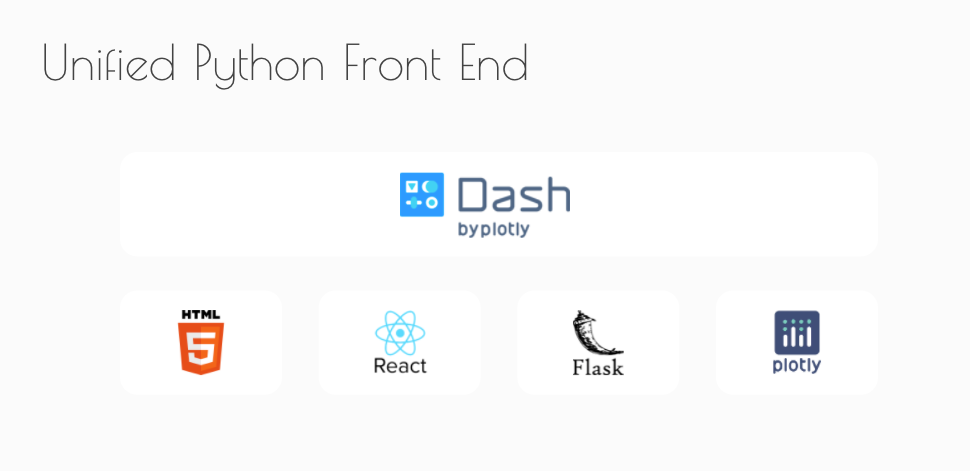
Dash abstracts HTML/CSS, React, Flask, and Plotly — wrapping it all in a unified and easy-to-use Python API. It does such a good job that you don’t even realize React is even involved without being told about it. There’s no Webpack JS bundling mess to deal with.
@app.callbacksprovides a Pythonic API for defining Controller methods.app.layoutprovides a Pythonic API for structuring Views that hook into the control layer. There are loads of pluggable Bootstrap components too.
from dash import html
import dash_bootstrap_components as dbc
from dash.dependencies import Output, Input# Layout with a dropdown & placeholder paragraph.
app.layout = html.Div(
    dbc.Select(id='dropdown', options=['hi','bye']),
    html.P(id='target')
)# Register inputs, outputs, and state (none in this case).
@app.callback(
    Output(component_id='target', component_property='children'),
    Input(component_id='dropdown', component_property='value'),
)
def hello_world(selection:str):
    return selection
- The callback monitors the input elements tagged with HTML IDs.
- The callback function runs.
- The callback updates the output of elements.
It’s really that simple!
📚 If you want to learn more, I highly recommend the book,
Interactive Dashboards and Data Apps with Plotly and Dash
by my new friend, Elias Dabbas. He does a great job of making this broad framework approachable in a piecemeal fashion.
⚖️ Pros and Cons of Dash

Pros:
- Pure Python — no JS nonsense! Unless you want to include your own JS
/assets. - The callback debugger is INSANE! It is so confidence inspiring that no matter how many callbacks you chain together, this thing has your back. It monitors your app in real-time and pulses with information as callbacks are fired.
- Jupyter and Django integrations.
- Cross-filtering aka interacting with Plotly charts.
- Multi-language for teams using Python/R/Julia.
- NEW: multi-page apps & parameterized routes.
Cons (minor/ areas for improvement):
- Sadly, the JupyterLab integration is unusable. Many analytics platforms serve JupyterLab, so if this integration was robust then Dash could become the app/extension framework of choice for Jupyter.
- The
DataTablecomponent is disappointing for a framework that is supposed to be about “Data Apps.” It’s neither easy to use nor style. I just wound up using Bootstrap tables. [UPDATE: see the new AG Grid component, which is not without its own quirks] - I really want a way to pass arguments into the
appduring initialization rather than just relying on globals in the.pyfile. - It felt like callbacks were converting all inputs to strings. Can’t use bool and int types. Kind of defeats the whole zero JS thing if you have to reserialize your data.
- I wish there was an option to refresh the entire app using
Intervalwithout having to painstakingly manage theStateof every callback. - Most of the docs focus on starting the Dash service from a raw
.pyfile, but it can actually be ran as a submodule too e.g.python -m aiqc.ui.app - Looking forward, they are behind the ball with WASM.
📬 Looking forward: distribution opportunities

In the SaaS world, first-mover advantage is typically everything. This is what makes Streamlit’s success so surprising. Recently, Snowflake acquired Streamlit for $800M 💸. It seemed like Streamlit came out of nowhere overnight. No offense to them, but it was so sudden that I just assumed that they either bought their likes or threw their entire first rounds of fundraising into social media campaigns to juice up their GitHub stars.
How did this happen? Allow me to paraphrase what I believe was Peter Thiel in Zero to One: “You have to be as innovative with your distribution strategy as you are with your product.”
On one hand, Streamlit has a free tier, an affordable teams tier, and is pushing community-developed components. On the other hand, what is Plotly’s strategy? They only negotiate enterprise contracts, and you have to host Dash Enterprise yourself because they have no hosted offering. Plotly has this massive userbase, but they are pricing themselves out of monetizing it. It’s absurd to me that a company with such popular open-source roots is not taking a wide-funnel platform approach. They aren’t living up to their potential.
Platforms (aka two-sided marketplaces) lead to exponential growth because:
- Platforms allow you to tap into assets of production that you don’t own. Communities literally build products and provide services for you. As opposed to relying solely on in-house sales/ dev teams to fulfill enterprise consulting contracts, which leads to linear growth.
- Platforms enable a network effect for quadratic growth.
🤔 Looking forward: is low-code the right move?
💸 Big low-code valuations
With companies like UiPath getting valued at $35B and GrandView forecasting the low-code market to be worth $87B by 2027 — I understand the temptation for Plotly to focus on low-code. It’s easy to assume that someone will win big in the “data science low-code app” space. And if you look at what Plotly has done in the past, then this seems like a natural progression:
- Plotly library → Chart-maker UI
- Dash library → Dashboard-maker UI.
From the boardroom, it looks like a great move, but as Aristotle says, “Question everything.”
📊 What does the data say?
I had the privilege of running the JupyterLab 2021 survey. We extensively surveyed over 1,100 data scientists about their use cases and paint points.
Data visualization was one of the focus areas:
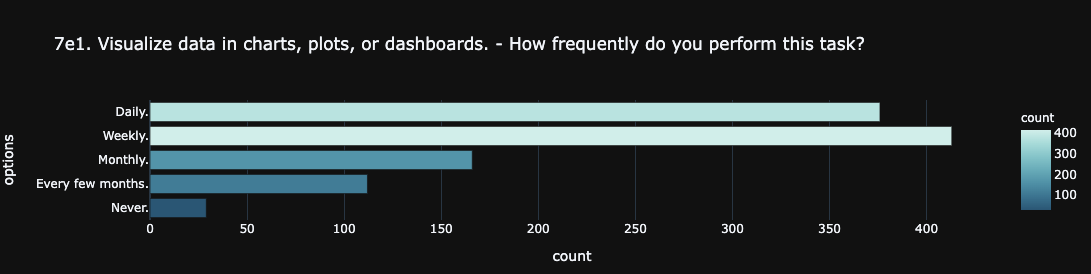

[Chart 7e1] Data scientists are frequently creating charts.
[Chart 7e] They are satisfied with their experience.
In fact, when the “no built-in UI for creating charts” pain point was surveyed, it was so non-existent that it ranked 30th place out of the 33 tested areas (4th to last). Would you bet the future of your company on the 30th best idea?
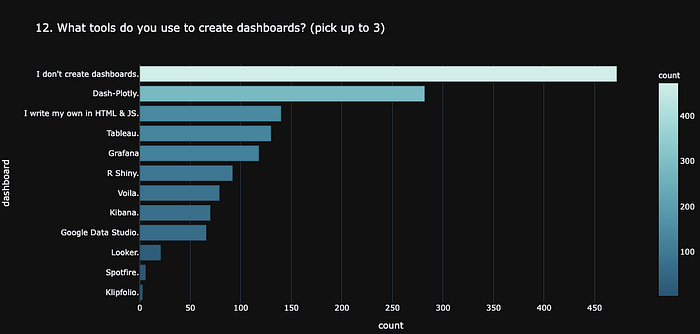


[Chart 12] Shows that Plotly is the dominant dashboard tool of choice.
Now let’s take a cross-section of survey respondents who said that they use Dash-Plotly to create dashboards. If we look at their visualization pain points, then we see that: [Chart left] low-code UIs are significantly less important in comparison to… [Chart right] simply having a place to put dashboards; think RStudio Server’s little blue button.
This data reinforces the idea that the Dash communit needs a platform where it can share Dash apps. This is important for Plotly because RStudio, the creators of R Shiny dashboards, has repositioned themselves as Posit in order to embrace Python (see my blog RStudio Re-Posit-ions for Success).
🤷 Opinion piece: Plotly’s high-level APIs are already low-code
Maybe data scientists find the the front end work required to construct and style their own HTML/CSS painful, so low-code Dash will be a big hit? Or low-code templates will help people get started before they transition into customizing the underlying scripts to suit their needs.
However, having just built a Dash app with chained callbacks and an interval-based refreshing State, the idea that it could be done with low-code feels really naive.
Besides, the real value of Dash is in the callbacks. Even with low-code, wouldn’t you still have to write thecallbacks yourself? So what’s the point? Is the point of low-code just to provide layouts? Is it all hype?
I’ve never met anyone who actually uses these Plotly chart-creator UIs, so why should we expect people to use a full-blown app-creator UI? I’m sure Plotly has some drag-n-drop functionality on a canvas-looking UI that looks slick in enterprise sales demos. Yet, as a product developer, when I think about from dash import html meets low-code — I can’t help but think of the eternal quest that Webflow has been on since 2013 to automate webpage creation.
Other doubts: If there is no code, then what’s the difference between Dash's low-code products and other low-code competitors — are they all the same to someone who can’t code? If you can’t use a high-level API, are you actually capable of building a worthwhile data app in the first place? How much benefit does low-code really offer business users over Pivot Tables in MSFT Excel, Google Sheets, Tableau, PowerBI?
It’s not that I think it’s impossible to achieve a low-code app builder. I just get the sense it’s a high-effort/ low-value initiative.
So maybe Plotly will get a big valuation increase from pursuing low-code, but I think the product itself is going to gather dust.
When Dash has the entire world of code-capable Python+R+Julia users to capitalize on, why is it pursuing low-code? Streamlit didn’t have to.
From where I am sitting, Plotly needs to refocus their strategy — move down-market and do some multi-tenant platforming in order to capitalize on their existing userbase.